© Javier Serna, Jesús Hernández and ARYSO group.
Please cite:
This is a semi-automatic tool designed to estimate the rotational velocity (vsini), using spectral lines of high-resolution spectra. The code was developed in Python 3.7 and the GUI in Qt 5.
- Add a new column with the relative error into Fourier.out
- Pop-up notifying error in line fitting. Suggest choosing another line or report as a non-detection line.
-
Gaussian Fitting is done for the spectral line of interest (Automatic selection of the center and width of the line).
-
Automatic saving at the event file "Fourier.out". The output file contains (1) The name of the input file, (2) date, (3) time, (4) line mid-wave, (5) line width, (6) Spectral resolution, (7) Limb-Darkening coefficient, (8) vsini in km/s, (9) vsini uncertainty in km/s.
-
Plot the histogram of vsini measures.
This tool is compatible with Python>2.7 on Linux, Mac, and Windows. Some packages are necessary for their proper operation.
- git
- Pandas
- Matplotlib.
- Tk
- Scipy
- PyQt5
- LMFIT
In case of not having any dependency, we suggest to install it in this way:
$ sudo apt install git
$ sudo apt install python-pandas
$ sudo apt install python-matplotlib
$ sudo apt install python-tk
$ sudo apt install python-scipy
$ sudo apt install python-pyqt5
$ sudo apt install python-lmfit
If you have an environment for Python> 2.7 (e.g., anaconda). The installation could be done in this way:
~(env)$ pip install pandas
~(env)$ pip install matplotlib
~(env)$ pip install tk
~(env)$ pip install scipy
~(env)$ pip install pyqt5
~(env)$ pip install lmfitFirst of all, we are going to create a folder where we will download the package:
$ mkdir Fourier
$ cd Fourier
$ git clone https://github.com/javiserna/vsini
$ cd vsini
and Execute:
$ python vsini.pyThe graphical interface of the program will appear
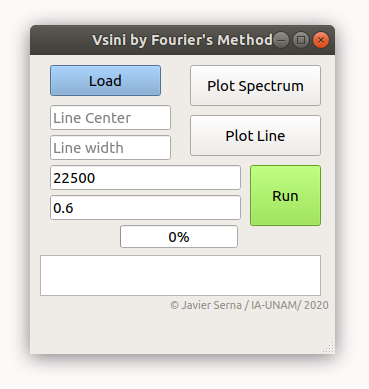
By default, the spectral resolution (R=22500) and limb darkening coefficient (0.6). These can be changed as the user requires.
Please press the "Load" button to get the spectra. CSV format for the input file is required, two columns of information, "col1": Wavelength and "col2": Flux. (e.g., load our test spectra "spec_to_test.csv").
Press the "Plot Spectrum" button to plot the input spectra.
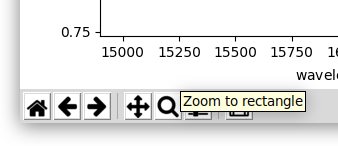
Use the “o” key and left-click to zoom in on the line of interest, or press the "zoom to rectangle" icon.
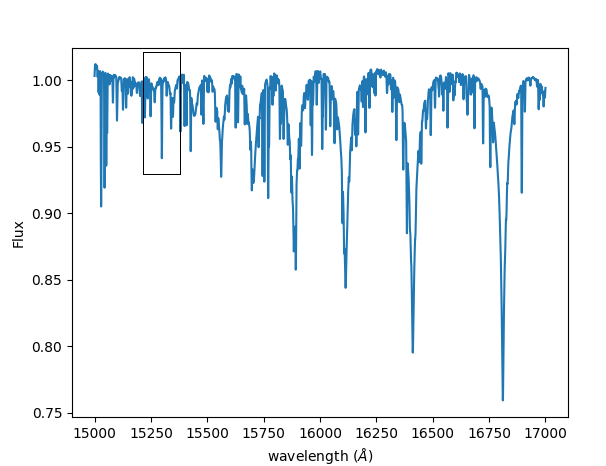
On each side of the line, press double click (A double click displays a vertical red line). When it is done, the program performs a Gaussian fit to the spectra within the defined window. It computes the midwave of the line and width as 3 sigma level. These parameters are updated to the text boxes "Line Center" and "Line Width" in the main window, once the user presses the "q" key.
Once the spectral line is selected, a visual inspection is necessary to check any issue (e.g., mixed lines, bad normalization, bad pixels, telluric lines, etc.). Press the "Plot Line" button, to plot the spectral line that will be used to measure vsini.
Once it is certain that the line does not present any problem. Let's continue to the next step (look at recommendations).
By pressing the "Run" button, vsini estimation is made. In the end, the tool plots a histogram with all random estimations of vsini. by pressing the "q" key, vsini and their uncertainty are loaded at the main window. Finally, all the information is saved in the event file "Fourier.out".
Once we have finished our measurements, then close the window and execute:
$ python results.pyThis script will organize the historical measurements located in the file "Fourier.out" For the set of spectra imported and the set of lines processed by the user. Finally, the user will have a file called "results.csv" with the spectra name, vsini, and vsini uncertainty.
The module auto_vsini.py provides a fully automatic, command-line workflow to measure v sin i from many spectral lines simultaneously in a 1D spectrum, without using the GUI.
For each input spectrum (CSV with col1 = wavelength, col2 = flux), the module performs:
-
Continuum estimation
- Computes a smooth pseudo-continuum using a Savitzky–Golay filter.
-
Line detection
- Detects absorption features in the continuum-subtracted spectrum based on a configurable S/N threshold.
-
Local line modeling
- Around each detected line, extracts a local window and performs:
- a single-Gaussian fit (line + linear continuum),
- a double-Gaussian fit (two components + linear continuum).
- Around each detected line, extracts a local window and performs:
-
Model selection & quality control
- Uses the Bayesian Information Criterion (BIC) plus morphological checks to:
- reject clear blends or emission lines,
- reject very narrow or unresolved features,
- reject overly broad structures dominated by continuum variations,
- optionally reject lines inside user-defined telluric bands.
- Uses the Bayesian Information Criterion (BIC) plus morphological checks to:
-
vsini measurement
- For each accepted line, calls the original Fourier method (
fourier.Fourier) to measure v sin i, - Estimates uncertainties using a bootstrap procedure with
nbootrealizations.
- For each accepted line, calls the original Fourier method (
-
Output products
- Generates an ASCII table
Fourier_auto.outwith one row per accepted line. - Optionally produces diagnostic plots of:
- the full spectrum with detected lines and Gaussian fits,
- individual line windows (accepted and rejected),
- summary histograms.
- Generates an ASCII table
This automatic mode is especially powerful for homogeneous v sin i measurements across large line lists or multi-epoch datasets, allowing consistent, unbiased, and reproducible analysis without manual line selection.
Running auto_vsini.py Basic example (single spectrum, default parameters):
$ python auto_vsini.py spec_to_test.csvA more explicit example, similar to the internal test setup:
$ python auto_vsini.py spec_to_test.csv \
    --detect-sigma 3.0 \
    --min-depth-sigma 3.0 \
	--R 22500 \
    --bic-delta 10.0 \
    --window 3.5 \
    --nboot 1001 \
    --show-plots \
    --save-plot spec_full.png \
    --save-grid spec_grid.png
You can also process multiple spectra at once:
$ python auto_vsini.py obs1.csv obs2.csv obs3.csv \
    --detect-sigma 3.0 \
    --min-depth-sigma 3.0 \
	--R 22500 \
    --bic-delta 10.0 \
    --window 3.5 \
    --nboot 1001 \
--output Fourier_auto.outAll results from all input spectra will be appended to the same Fourier_auto.out file
(with the file name included in each row so multi-epoch data can be tracked).
auto_vsini.py accepts the following main options:
- spectra
One or more input spectra in CSV format containing:col1: wavelength (Å)col2: flux
-
--epsilon(float, default: 0.6)
Limb-darkening coefficient used by the Fourier method. -
--R(float, default: 115000.0 HARPS Resolution)
Spectral resolution ( R = \lambda / \Delta\lambda ).
Sets the instrumental broadening used internally byfourier.Fourier. -
--nboot(int, default: 1001)
Number of bootstrap realizations offourier.Fourierper line.
Higher values → more robust uncertainties (slower runtime). -
--window(float, default: 1.0 Å)
Approximate half-width (in Å) of the local spectral window used for:- Gaussian fitting
- Fourier vsini measurement
(internally scaled to ~6σ total width).
-
--bic-delta(float, default: 10.0)
Threshold in ΔBIC used to reject blended lines.
If the double-Gaussian model improves the BIC by more than this value
and the two components are sufficiently separated and comparable in depth,
the line is flagged as a blend and rejected. -
--min-depth-sigma(float, default: 3.0)
Minimum line depth (in units of local noise σ) required to accept the line. -
--detect-sigma(float, default: 3.0)
Detection threshold (in σ) applied to the residual (continuum-subtracted) spectrum. -
--output(str, default:Fourier_auto.out)
Name of the ASCII output file where per-line results are stored.
If the file already exists, new rows are appended. -
--show-plots(flag)
Display diagnostic figures interactively. -
--save-plot(str)
Path for saving the full-spectrum plot, including:- Savitzky–Golay pseudo-continuum
- Detected lines
- Overplotted Gaussian fits
-
--save-grid(str)
Base path for saving:- Grid of accepted line fits
- Grid of rejected line fits
- Histograms of Gaussian widths
Output from auto_vsini.py
The script writes an ASCII file, by default: Fourier_auto.out
with a header:
#file date time lambda width R epsilon vsini vsini_err snr redchi_single delta_bicand one row per accepted line containing: 1. file – spectrum file name 2. date – UTC date at run time 3. time – UTC time at run time 4. lambda – fitted line center (Å) 5. width – effective width used for Fourier analysis (Å) 6. R – spectral resolution used in the Fourier call 7. epsilon – limb-darkening coefficient 8. vsini – median vsini from the bootstrap (km/s) 9. vsini_err – standard deviation of vsini from the bootstrap (km/s) 10. snr – approximate depth S/N of the line 11. redchi_single – reduced χ² for the single-Gaussian fit 12. delta_bic – ΔBIC = BIC_single − BIC_double (diagnostic of blending)
This file is intended for further statistical analysis (e.g., computing global vsini from many lines, filtering by S/N, etc.).
© Instituto de Astronomía / UNAM (Ensenada, B.C, Mexico) 15 September 2020 – updated with auto_vsini.py automatic mode at University of Oklahoma / (Norman, OK, United States) 28 November 2025.