Contains code and results from my work in Dr. Amy Orsborn's lab. The aim of the behavioral analyses is to identify patterns between eye movements and performance on each trial of the center-out reaching task. The aim of the neural analyses is to study changes in connectivity across trials, and to identify patterns relating activity and plasticity to eye movements and trial performance. (Not all results are shown because I no longer have access to the datasets.)
Contains code from some of my work in Dr. Sameer Sheth's lab. The aim is to decode mood state from neural activity (stereo-EEG signals) in treatment-resistant depression patients, eventually for closed-loop deep brain stimulation. The code performs dimensionality reduction on high-dimensional neural data then regresses mood state onto neural activity. It selects one model after fitting multiple candidate models which vary by region of neural activity and number of principal components retained. It uses leave-one-out cross-validation to evaluate the model due to the sparsity of mood state measurements, and a nested leave-one-out cross-validation stage to select the candidate model for each outer fold.
The script to run is "MoodDecoding.m". (It relies on my functions "modelAndPredict.m" and "evaluateCandidateModels.m".) "MoodDecoding.m" will output four figures. Figure 1 plots the prediction of mood state against true mood state using neural activity from one selected brain region (each test prediction datapoint corresponds to one fold of cross-validation):
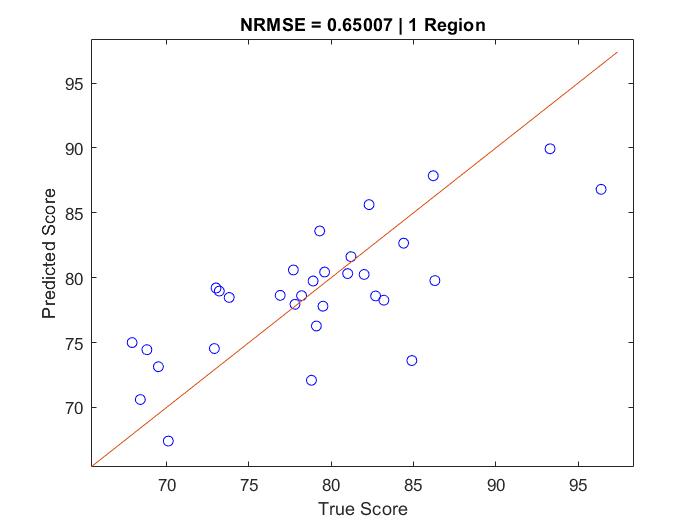
Figure 2 plots the results of a permutation test run with this model to evaluate the significance of its prediction accuracy:

Figure 3 is a similar plot to Figure 1, except depicting the results of a model which uses two selected brain regions, performing worse:
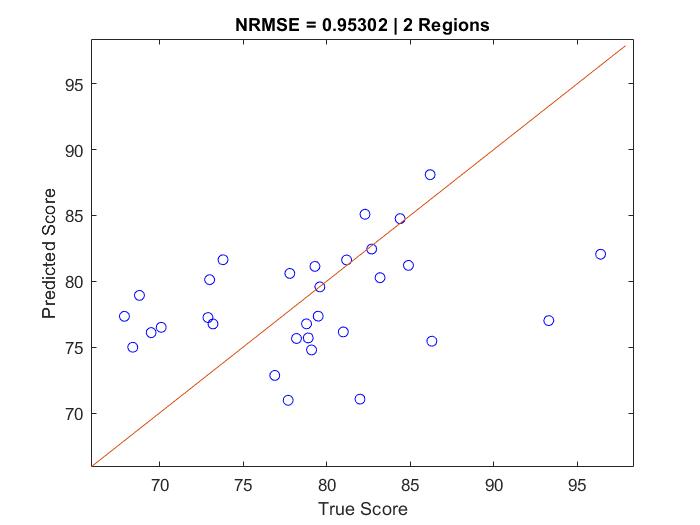
Figure 4 plots the magnitude of the regression coefficients for the power features back in the original feature space to interpret which features are most predictive of mood:

The script can be modified to run on another dataset by changing the patient number on line 2 (options are "001" or "002").
Contains code and data I collected from some of my work in Dr. Jacob Robinson's lab. I built an alternating magnetic field generator and printed circuit board with a pickup coil to collect magnetization data from magnetic nanoparticles. The code processes these data to capture the hysteresis loops of the nanoparticles. The file "HysteresisLoops.m" is the code and the folder "CodeExamples/AC Magnetometer/55kHz" contains the data.
To collect a clean hysteresis loop from nanoparticles, I had to take two recordings of a nanoparticle sample and three recordings of a water sample (a control for further denoising the magnetization signal), then process all six combinations from these trials before selecting the cleanest hysteresis loop. "HysteresisLoops.m" yields three figures as output: Figure 1 plots the hysteresis loops colored by period of the magnetic field for each of the six combinations:
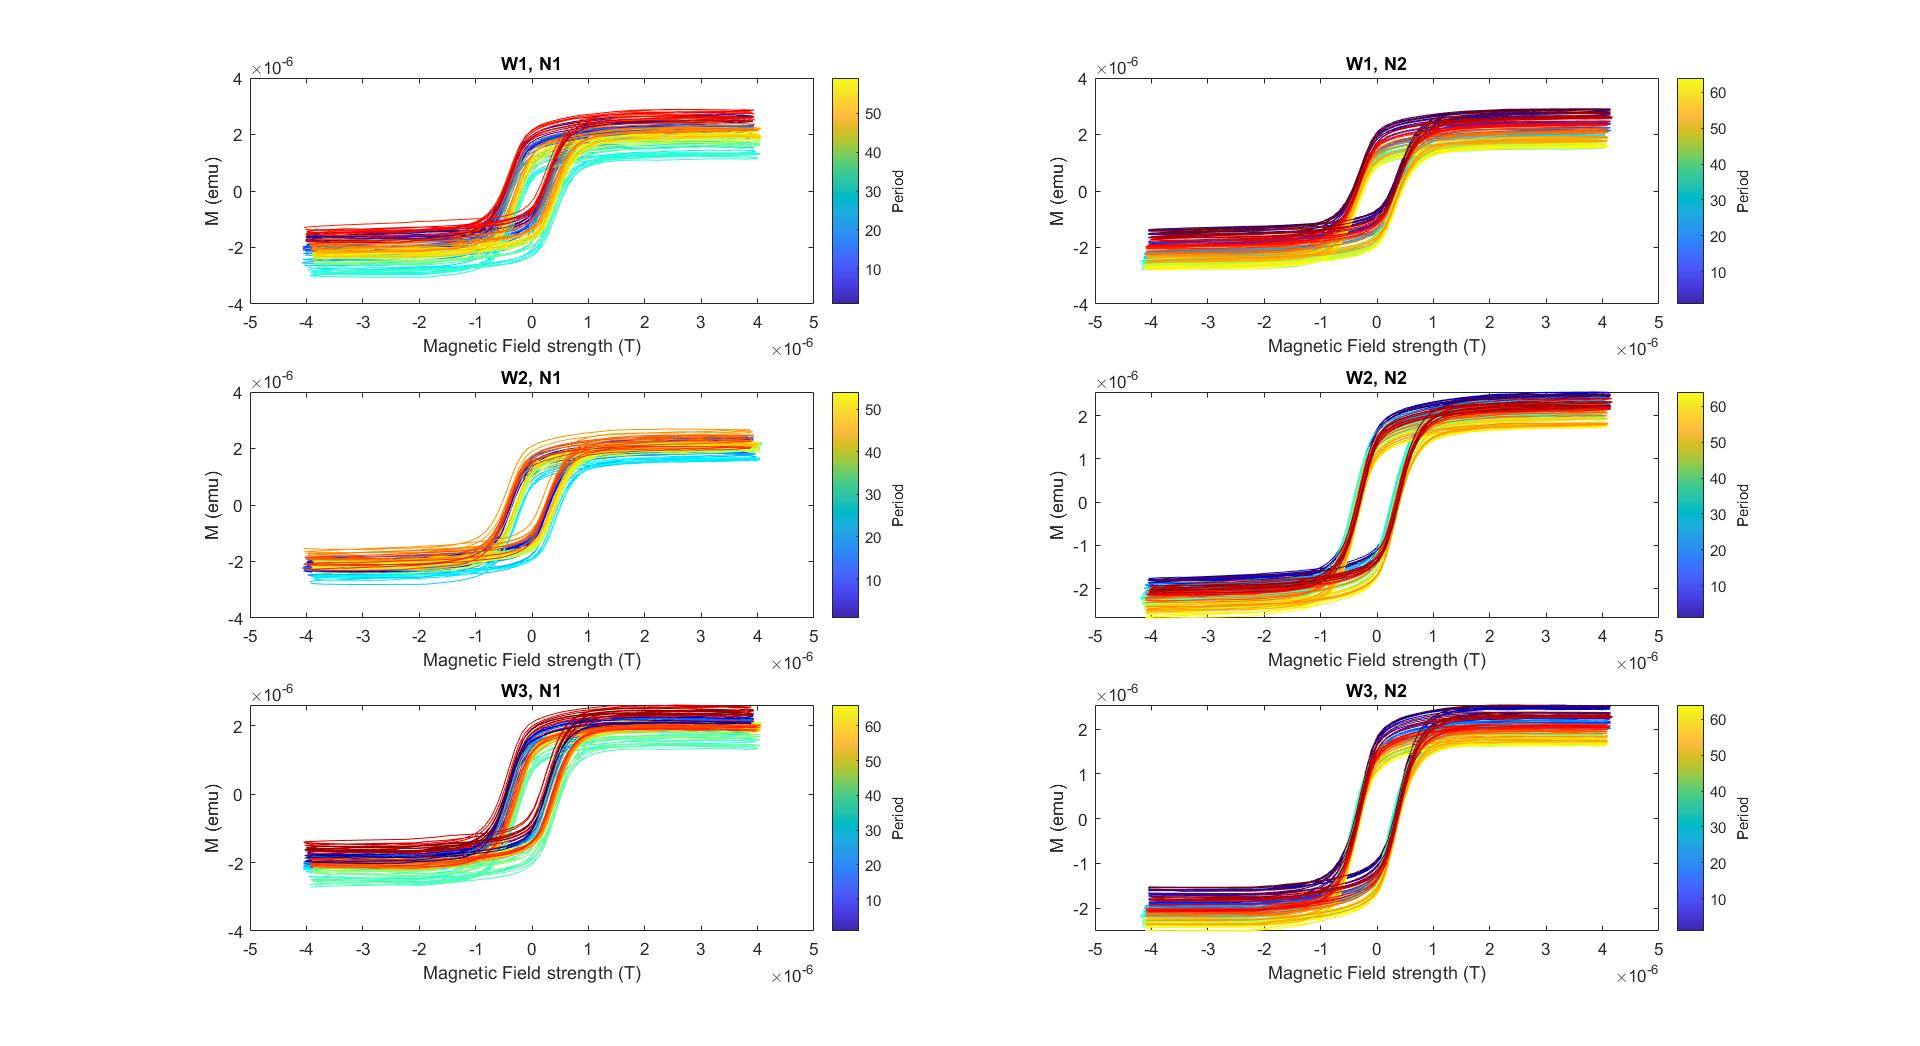
Figure 2 plots the average hysteresis loop from each water-nanoparticle sample combination after centering. Clearly, some loops are cleaner than others at the edges near saturation:
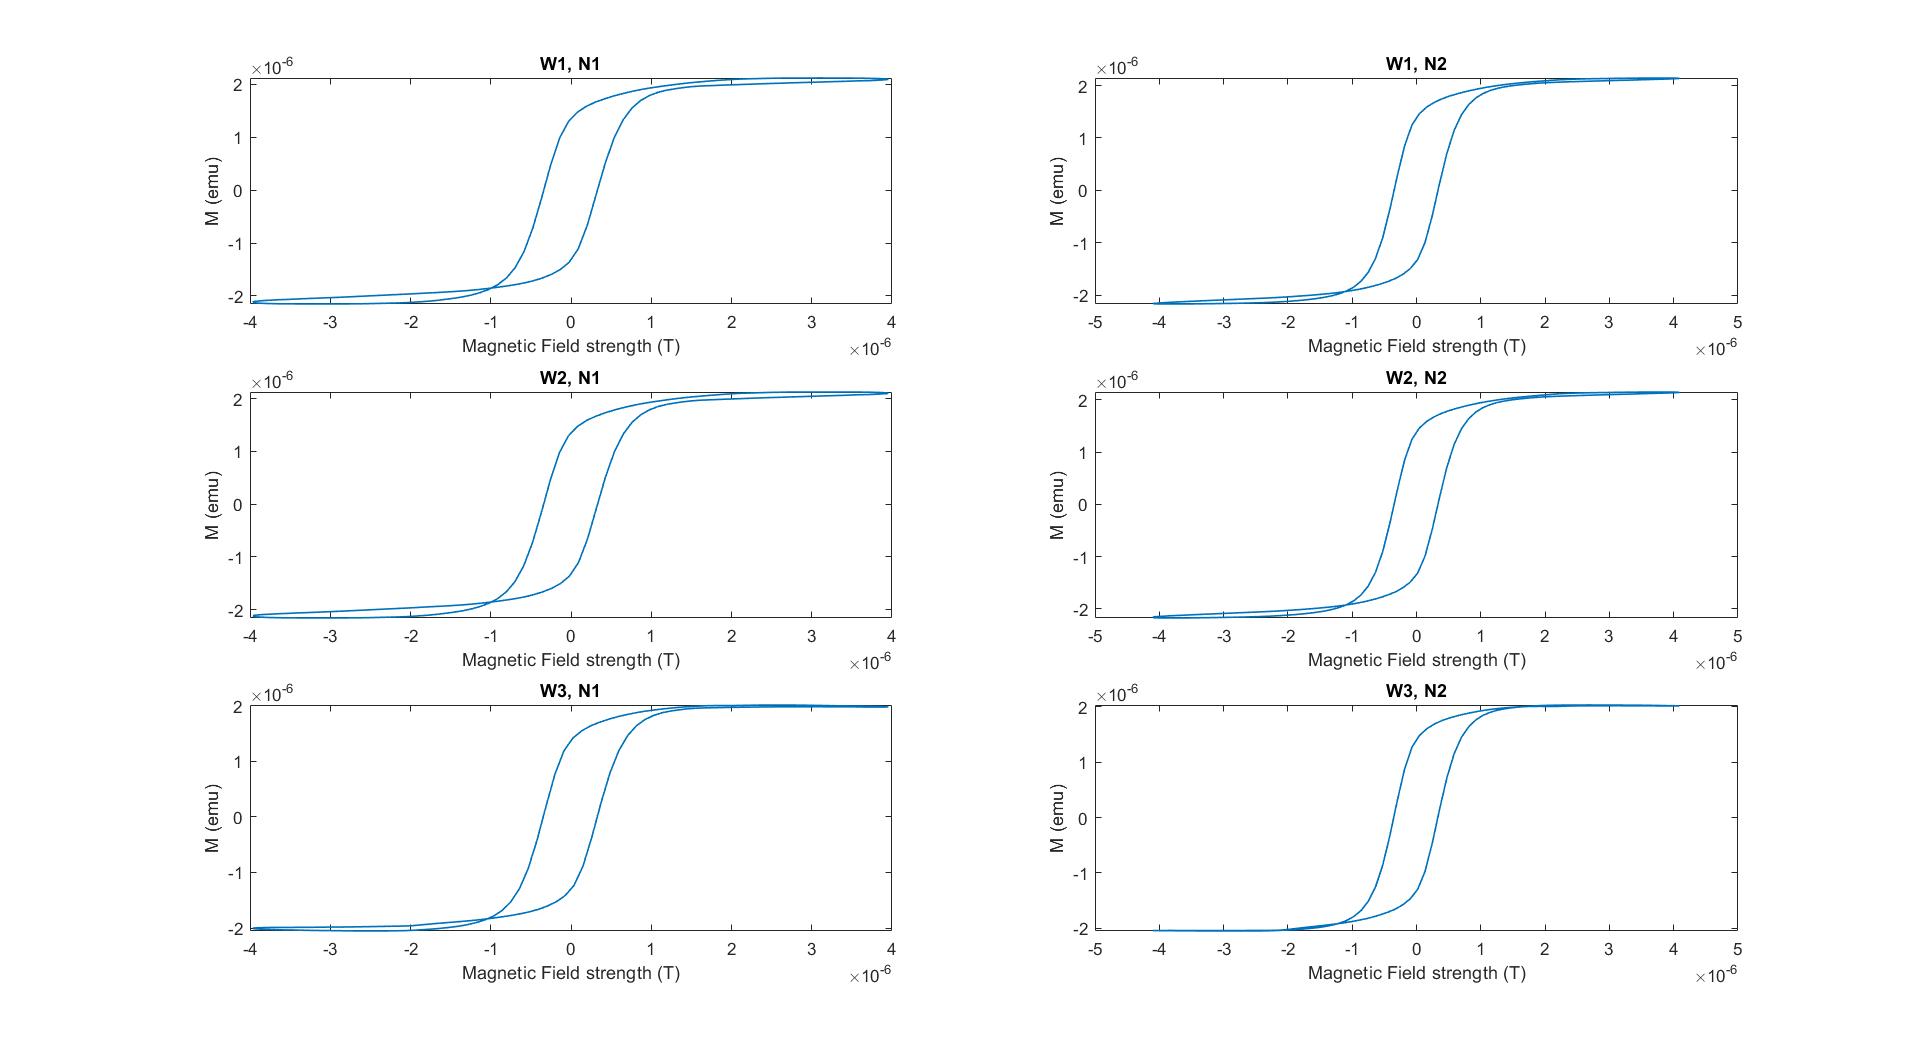
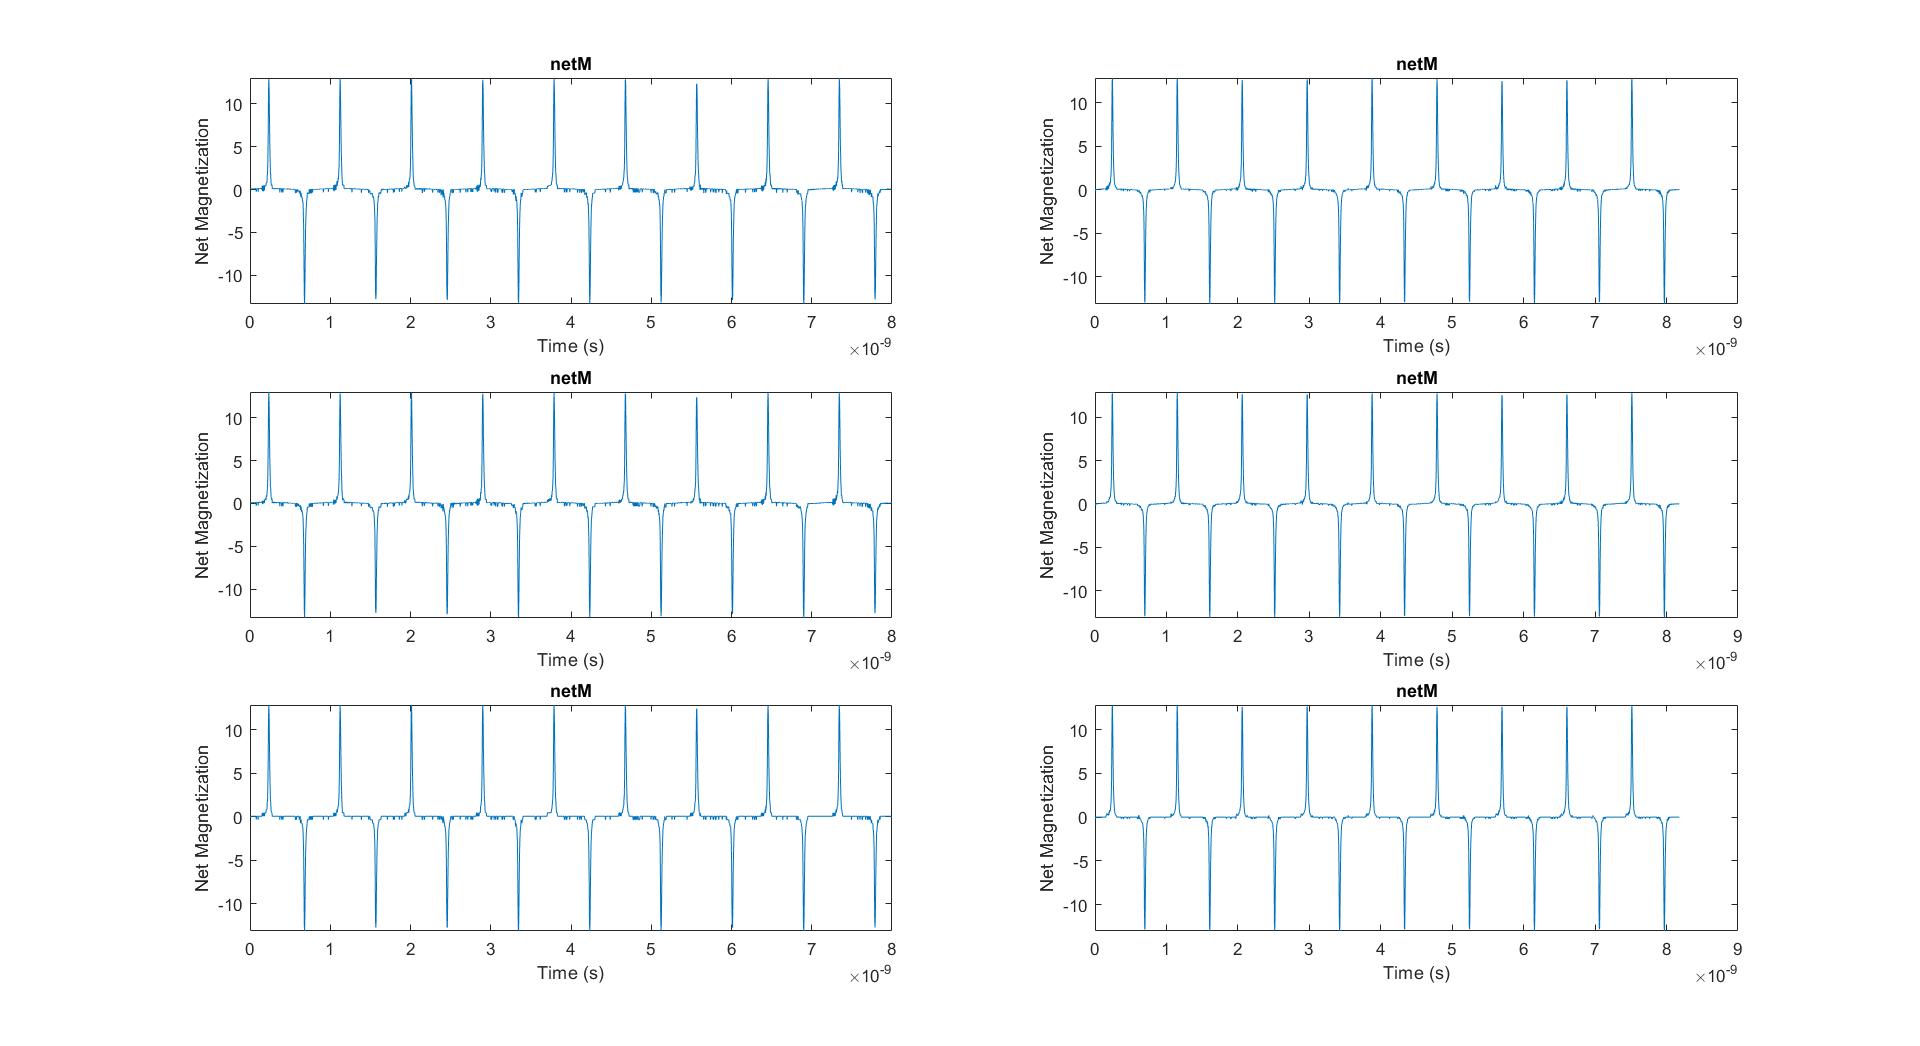
Figure 3 plots the average net magnetization signal (water minus nanoparticle) from a few periods of the recording:
The script can be modified to run on data collected at a different magnetic field strength (change "voltage" on line 3), or data collected from other types of nanoparticles by selecting another one of the options under line 6.